"Analysis of Web Content Delivered to a Mobile Computing Environment"
Anthony PerreaultAnthony Perreault is a senior at New Mexico Tech, majoring in Technical Communication with an emphasis in computer science and web design. While taking classes, Anthony also works full-time at the National Radio Astronomy Observatory's Pete V. Domenici Science Operations Center as an operations specialist for the Very Long Baseline Array radio telescope where part of his duties include maintaining and upgrading operational documentation. Anthony worked with Dr. Julie Dyke Ford on his senior thesis project, Analysis of Web Content Delivered to a Mobile Computing Environment.
ContentsBackground of Wireless Technology Selection of Sites for Analysis |
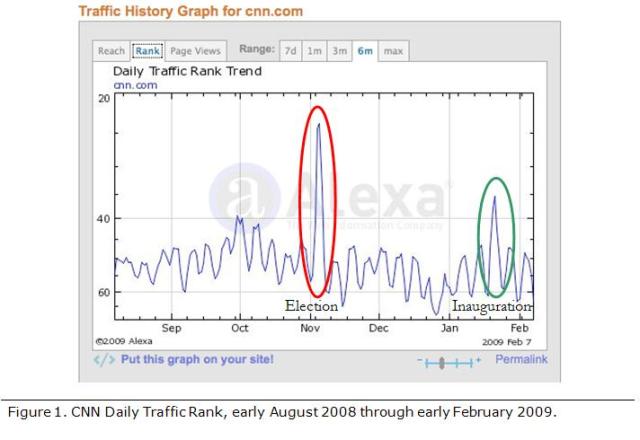
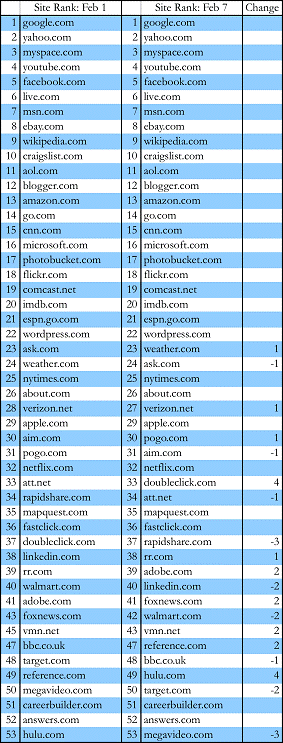
Survey of US Web TrafficIn order to understand whether the context of the information of a web site is rendered unusable in the mobile environment, it was necessary to analyze web traffic to determine what web sites people were visiting. I conducted a survey of the top-ranked US sites, measured by web traffic, as reported by the web traffic analyzing organization Alexa for a seven-day period from February 1st through February 7th, 2009. The survey objective was to track web traffic of top sites visited by US users across a typical week. With this data I could then view the same sites on the iPod Touch in order to analyze the sites in a mobile computing environment as to their functionality and usability. Prior to conducting this survey, I had to find web sites that aggregated web traffic data. My initial search resulted in three web site traffic aggregators: Alexa, Quantcast, and Technorati. Two of these aggregators, Alexa and Quantcast, collect web traffic data in a similar fashion through the use of subscribers who report back to the aggregator site their web usage as well as other methods of collecting web traffic statistics. Due to the proprietary nature of these methods, neither aggregator company disclosed how they collect the other web traffic data. Technorati aggregates web traffic data that is specifically targeted towards web logs, or blogs; the basis of Technorati’s web traffic accounting is partially linked based—the more links a blog has, the higher the ranking placement. In researching Technorati I discovered that the blogs could be cross-listed in multiple categories and that some of the top-ranked blogs had not be updated recently. Due to the focus on blog content, I decided not to use Technorati. This left me with Alexa and Quantcast as providers of web traffic data. Researching Quantcast I discovered that the web traffic information provided lagged by more than a month; in November, for example, I was looking at September’s web traffic data. Moreover there was no day-to-day breakdown of web traffic—the traffic ranking appeared to be an average from their user base and other web traffic statistics. Alexa shows the top 100 US sites by web traffic as a running three-month average. In reviewing this data several times across the span of a week, I could see fluctuations in web sites that reflected the ongoing changes in web traffic. Alexa also provides web traffic, pageview, and reach data (from Alexa’s website, reach is “…determined by the number of unique Alexa users who visit a site on a given day”) for web sites with a data history of the six previous months. Even though Alexa has a database of users that provide web traffic and other data, the day-to-day monitoring and fairly rapid reporting of the data made Alexa the web traffic data aggregation site that would be able to provide the web traffic data that I was looking for. I now had to select a time period that would reflect normal web traffic and usage. I did not want to collect data around January 20th, 2009, since this was the date of the inauguration of President Obama and I felt that there might otherwise be unusually high traffic to the online news services such as CNN, MSNBC, and Fox News. In looking at the traffic graph for CNN from Alexa, my assumption was correct, though there was not as large a spike in traffic as there was around Election Day in November (Figure 1).  I selected the first week in February to conduct the survey. In selecting this week I forgot that February 1st, the first day of the survey, was also the day of the Superbowl. I was surprised to see no significant jumps in web traffic to news or sports sites; there was, however, a spike in the increase of traffic to Hulu, an online streaming video site (Figure 2). I learned later that Hulu had aired a humorous commercial during the Superbowl with Alec Baldwin posing as a member of an alien race sucking the mushy brains out of humans watching streaming videos on Hulu. While Hulu’s traffic had been climbing for the previous six months, the spike in their web traffic can be correlated to the Superbowl ad. For me, this spike in traffic just re-affirmed the use of Alexa to collect the web traffic data.  Survey Methodology & Data Collection The daily web traffic as indicated in table 1 was not just limited to US traffic—it reflects worldwide traffic figures. These figures account for the apparent discrepancy between US and worldwide traffic ranking, such as live.com (Microsoft’s Internet portal) and youtube.com (video streaming site) switching places during the week of the survey but not changing rank status when looking at only the US data set. The worldwide traffic ranking also explains missing numbers and sites, for example there is no site with a web traffic ranking of 10—this is most likely the result of the site being a foreign site; such as Amazon UK (or France or Germany), or one of the foreign Google sites such as google.uk. Table 1 lists the data from the survey. The first column is the US web traffic three-month average ranking for the corresponding site in the second column. The next seven column pairs reflect the ranking of the web site based upon worldwide traffic. A quick glance will show some variation in traffic rankings. Again, some sites are missing from the data set due to the lack of correlation between worldwide visitors and US-only visitors. 
Table 2 lists the top 49 US sites at the start and end dates of the survey along with change in ranking by web traffic. Of the sites listed there were no change in ranking among the top 22 sites. With the remaining 31 sites, there were ranking changes as much as ± 4 positions; of these sites, doubleclick.com (an online advertising site) and hulu.com (online streaming video site) each shifted their ranking upwards by four positions—37 to 33 for doubleclick.com and 53 to 49 for hulu.com—by the end of the survey. The biggest losers were rapidshare.com (an online file sharing site) and megavideo.com (another online streaming video site); each site dropped three positions, from 34 to 37 for rapidshare.com and from 50 to 53 for megavideo.com.
Table 3 reflects the list of the 49 sites that were visited with the iPod Touch and notes whether the sites were optimized for mobile content or not. Of the 49 sites, 19 (39%) were optimized for mobile content—these sites are shaded in the table. Notice that the nytimes.com site has an asterisk next to it; while the web site itself is not optimized for mobile content, there is a free NY Times application available from Apple’s iPod Touch/iPhone App store that will deliver optimized mobile content from the NY Times web site.  |
Pages: 1· 2· 3· 4· 5· 6· 7· 8· 9· 10· 11· 12· 13· 14· 15· 16· 17· 18· 19
