"Mobile, Handheld Devices with Touchscreens: How Perceived Usability Affects Communication"
Rebecca BirchRebecca is a New Mexico Tech graduate who recently discovered the joys of tutoring and mentoring high school students in mathematics and language arts. While working with her students, Rebecca has learned much about the nuances of touchscreen technology and the role it plays in their communication. Other tactile activities include rock climbing, playing the viola, and enhancing her side work as a photographer. ContentsDiscussion on HTDs in Regard to Literature and Survey |
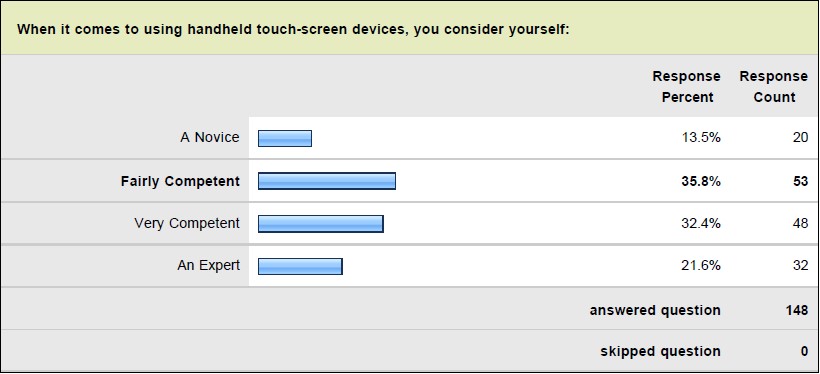
SurveyIn order to gain the all-important user’s perspective on HTD usability, I conducted a brief survey. The goal of the survey was to gain a better understanding of how users perceive the usefulness and usability of HTDs they use or have used. The survey was a total of ten questions long, and asked a mix of quantitative and qualitative questions (to view the entire survey, please refer to Appendix A). MethodologyI created the survey through the online survey tool, Survey Monkey; links to the survey were distributed through the listservs Association of Teachers of Technical Writing (ATTW) and Council for Programs in Technical and Scientific Communication (CPTSC) as well as the social networking website Facebook. Participant’s personal information was not collected; the survey was anonymous. This survey was approved by the Internal Review Board of New Mexico Tech prior to being distributed. ResultsI collected a total of 148 responses between October 29, 2010, and January 23, 2011. In response to the question “When it comes to using handheld touch-screen devices, you consider yourself:__”, only 13.5% of the 148 respondents felt they were novice-level users, and only 21.6% felt that they were expert users. A combined 67.12% of respondents felt that they were either fairly or very competent; 53 respondents (35.8%) said they were fairly competent, and 48 respondents (32.4%) said that they were very competent. Figure 3 shows the breakdown of responses to this question.  Figure 3. Perceived respondent competency.
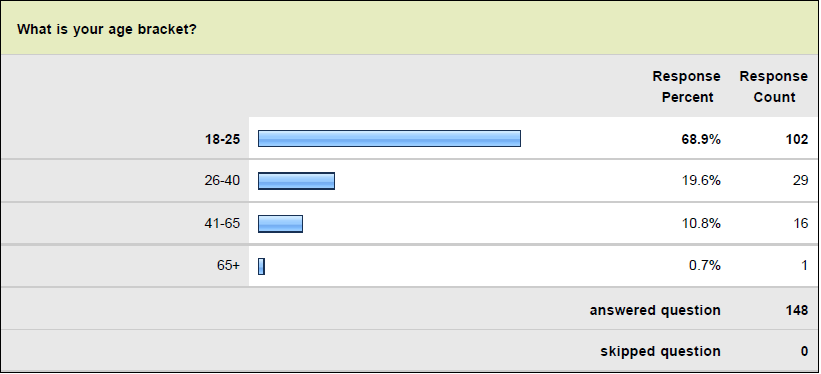
When it came to age, the greatest majority of respondents, 68.9%, fell into the 18-25 year-old group. 19.6% of respondents belonged to the 26-40 year-old range, and only one respondent was 65 years old or older. Figure 4 represents the age breakdown of respondents.  Figure 4. Breakdown of age groups. When it came to owning an HTD, 40.5% of respondents said that they did not own an HTD. 28.4% of the respondents who did own an HTD owned an iPod Touch, and 14.9% owned a Nintendo DSi.  Figure 5. HTDs respondents owned.
The other devices listed were:
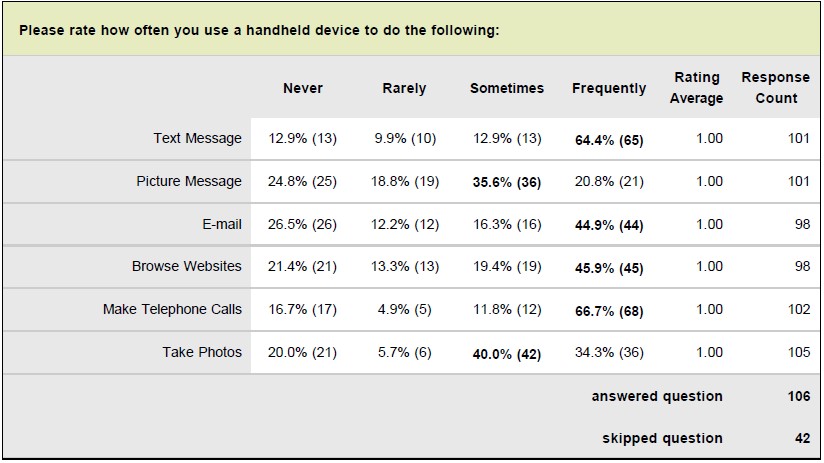
The more popular “other” responses were Motorola’s Droid variations, the Nintendo DS variations, Apple’s iPad, T-Mobile’s Mytouch variations, HTC’s Incredible and Droid Eris, and HP’s Palm variations: a total 33 of 50 responses. Of these 33 responses, 10 went to Motorola’s Droid variations and 8 to the Nintendo DS variations; only 4 respondents named the iPad. However, when asked what devices respondents had used before, the iPad was the fourth most-popular device, listed 22 times. The iPhone and iPod Touch were by far the most frequently used, with 66 and 65 mentions, respectively. Third most popular was the Nintendo DS, with 26 mentions. I asked participants to rate how often they used an HTD to do the following tasks: making phone calls; sending picture messages; sending text messages; browsing websites; sending, receiving, or checking e-mail; and taking photos. The responses could be “Never,” “Rarely,” “Sometimes,” or “Frequently.” A total of 106 participants responded to this question, and the other 42 skipped it. Making phone calls was seen to be the most common activity frequently performed on HTDs, and sending text messages was almost as common. Sending and receiving e-mails and website browsing were the next most-frequently performed tasks. Taking and sending photos were only sometimes done on respondents’ HTDs. The statistical breakdown of results can be seen in Figure 6.  Figure 6. How often specific tasks were performed.
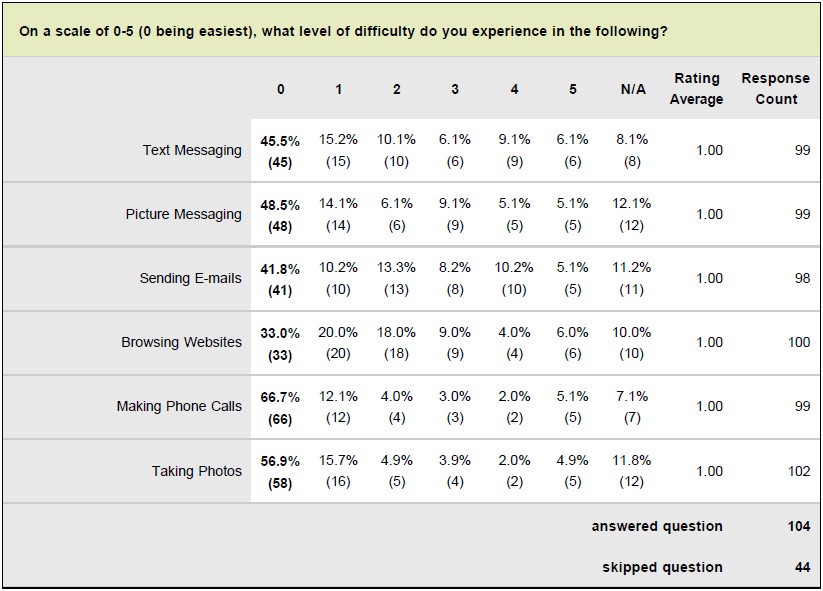
I also asked participants to rate the level of ease or difficulty they experienced in performing the following tasks on an HTD: text messaging, picture messaging, sending and receiving e-mail, browsing websites, making phone calls, and taking photos. I found that in general all of these tasks were perceived as easy to perform. Figure 7 shows the statistical breakdown of responses.  Figure 7. Breakdown of perceived task difficulty.
|